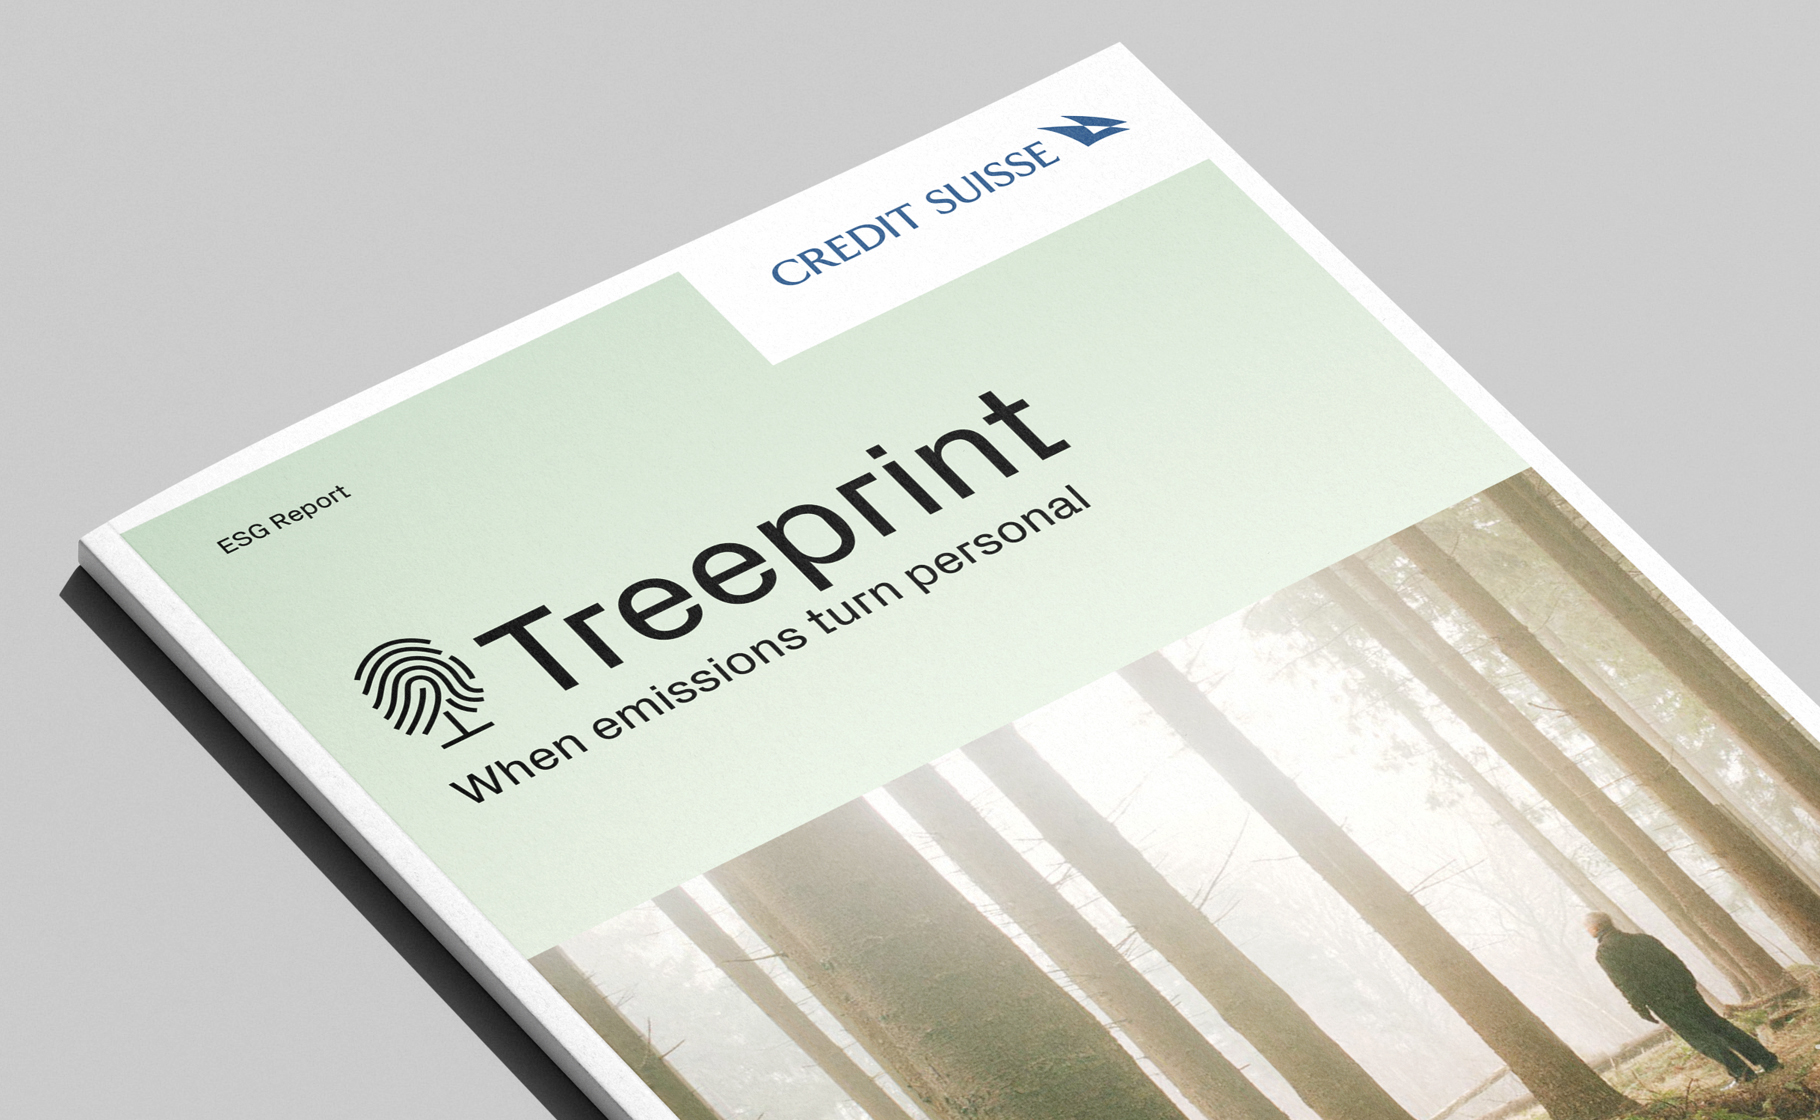
Another project created for Credit Suisse. The bank wanted to show, in a clear and fact-based way, how our actions translate into emissions and their impact on the environment.
The series of reports was meant to bring together two worlds: finance and ecology. Both rely on a large amount of data, but are often communicated in a complex and difficult-to-digest way. Instead of creating another publication that looked like a typical financial report, I wanted to find a more engaging way to present the information.
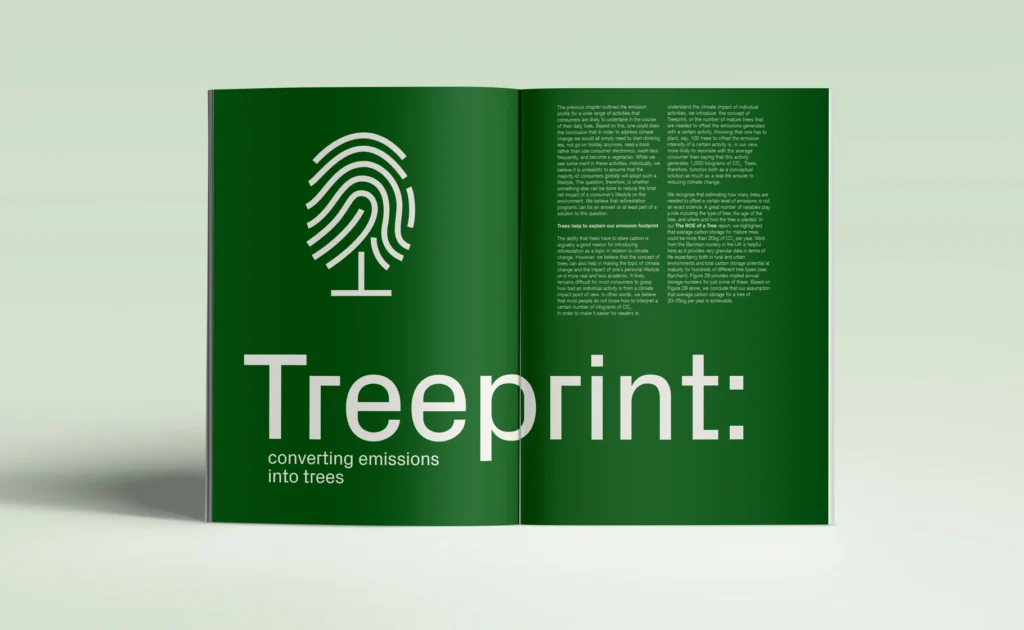
The starting point was a mark combining a fingerprint with the form of a growing tree. It was meant to represent the individual impact we have on the environment and became the foundation of the visual concept.
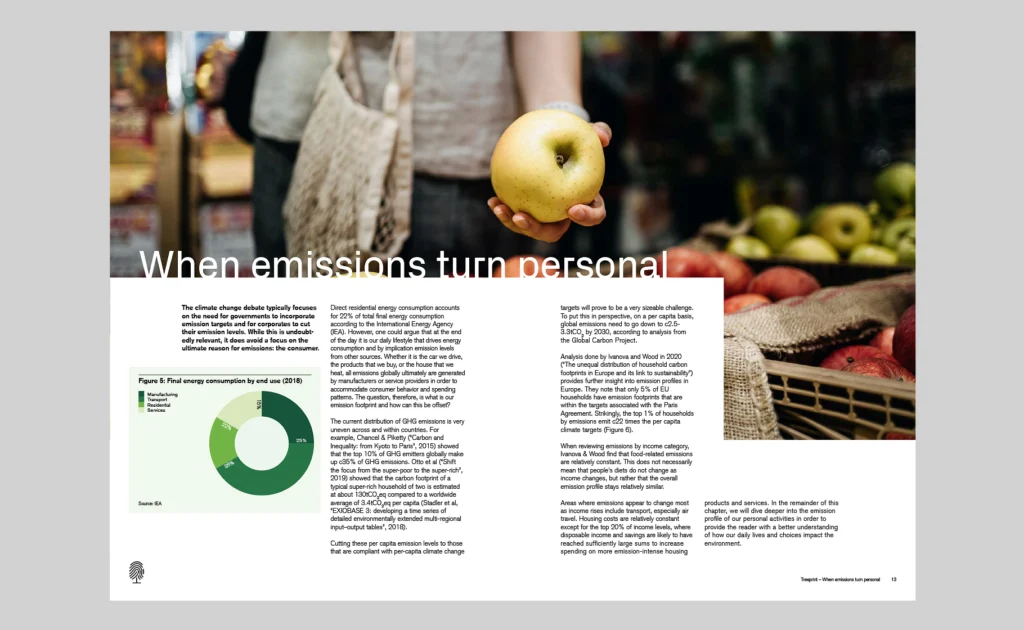
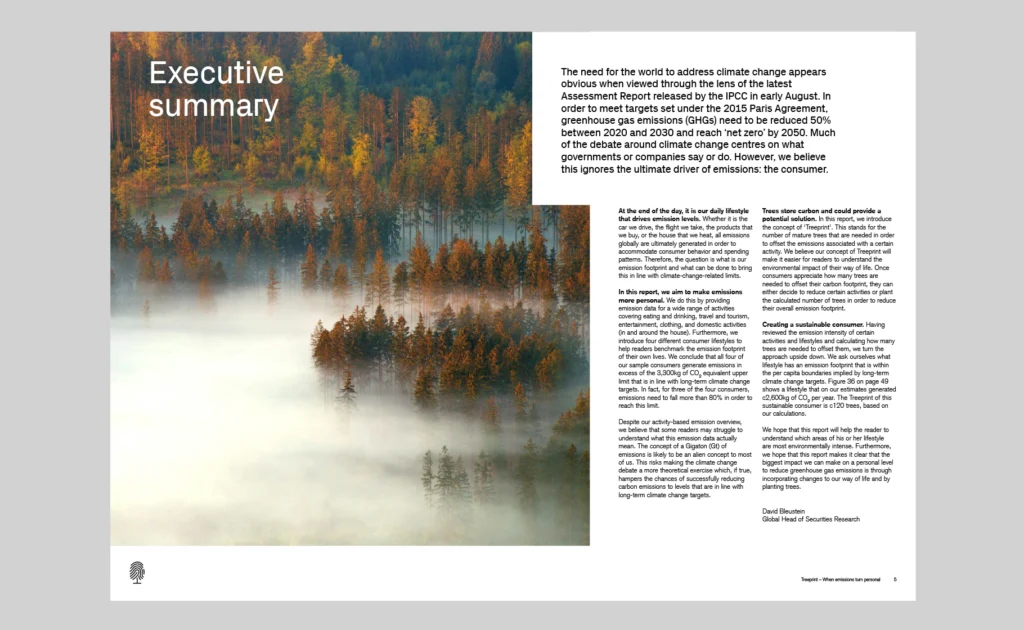
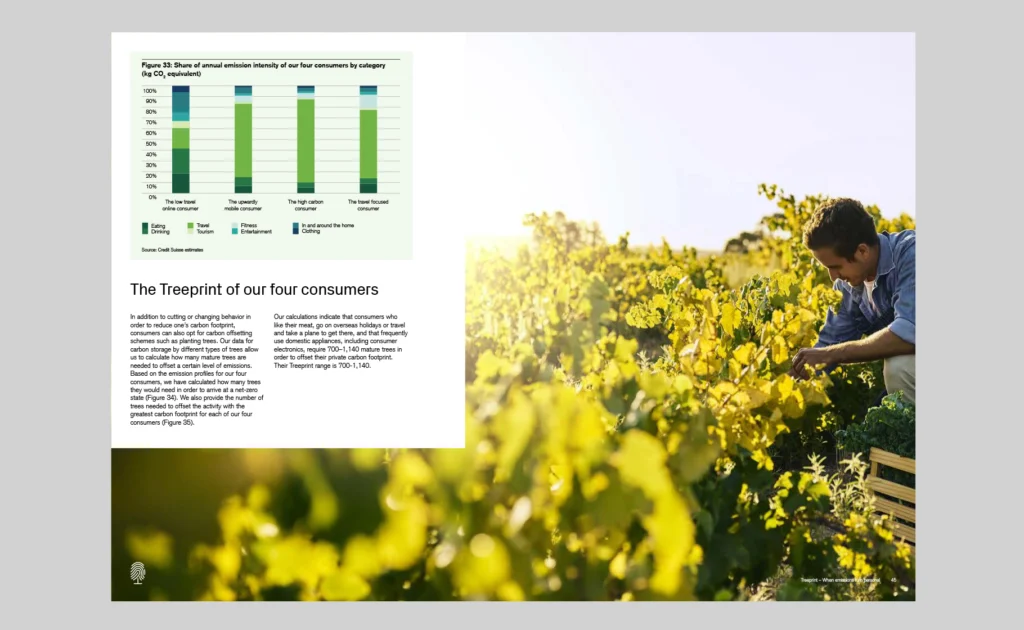
I designed the first report more like a magazine than a traditional financial publication. Large images, plenty of white space and a clear hierarchy helped make a large amount of information feel less overwhelming.
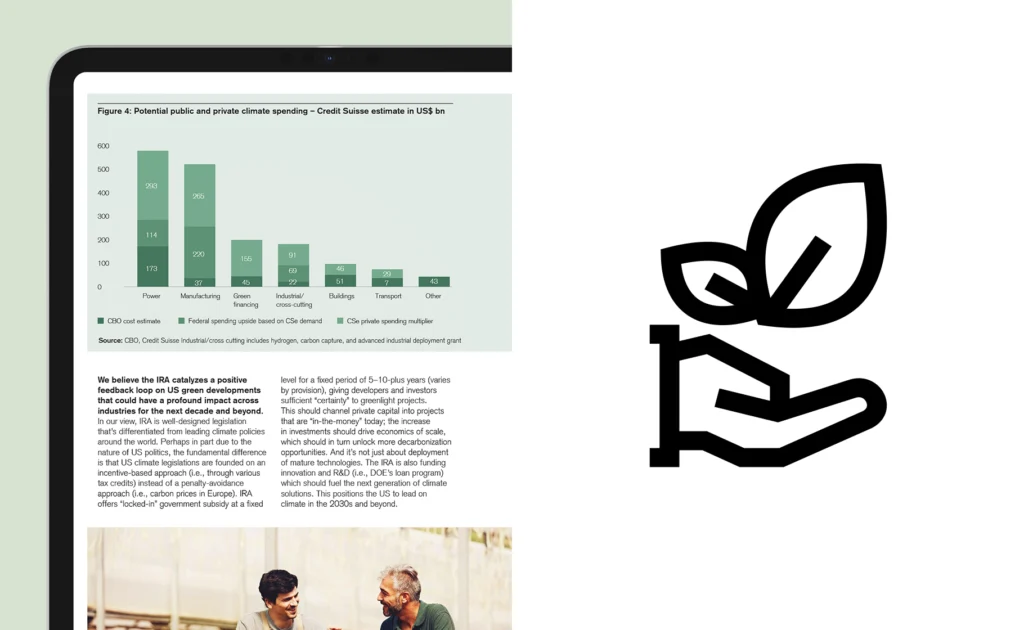
The images provided context and drew attention, while charts, tables and figures delivered the facts. It was also important to create a clear flow through the publication, making it easy for the reader to move between different pieces of information.
Based on the first report, I developed a system for building future publications, keeping a consistent character while allowing space for different topics and data.
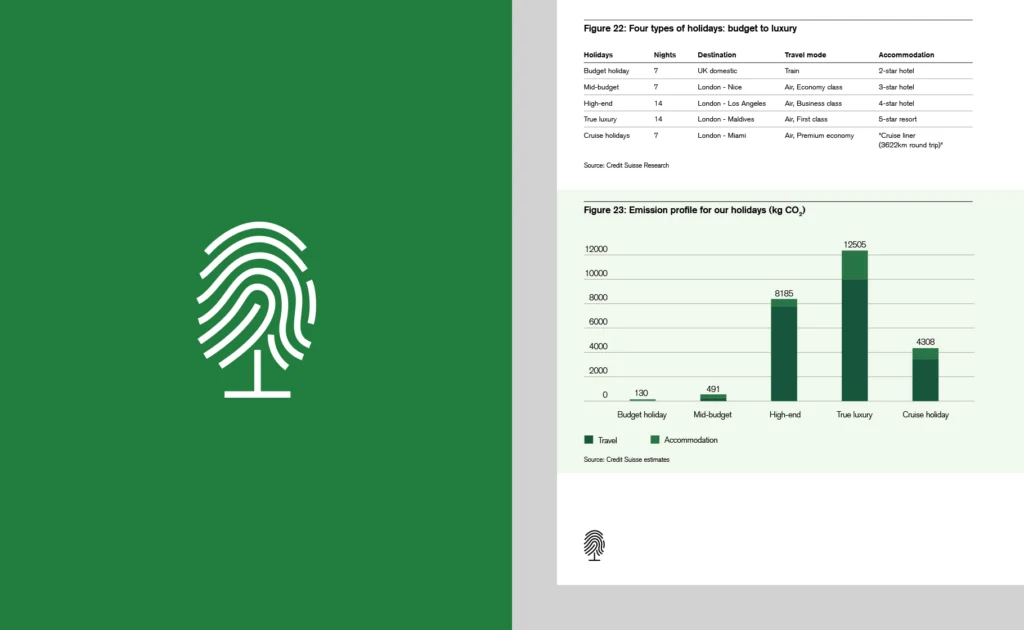
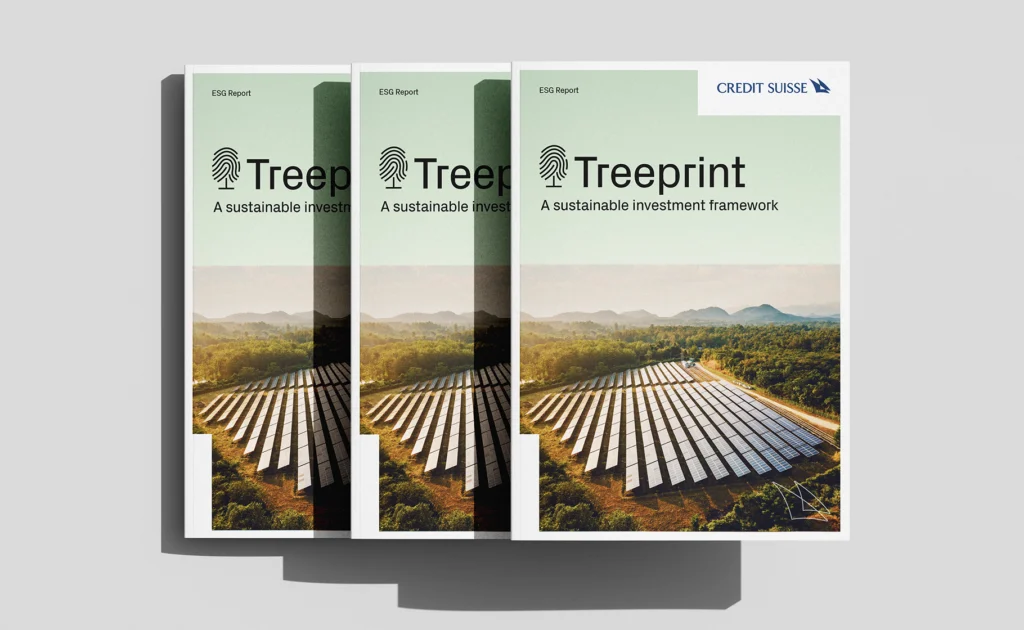
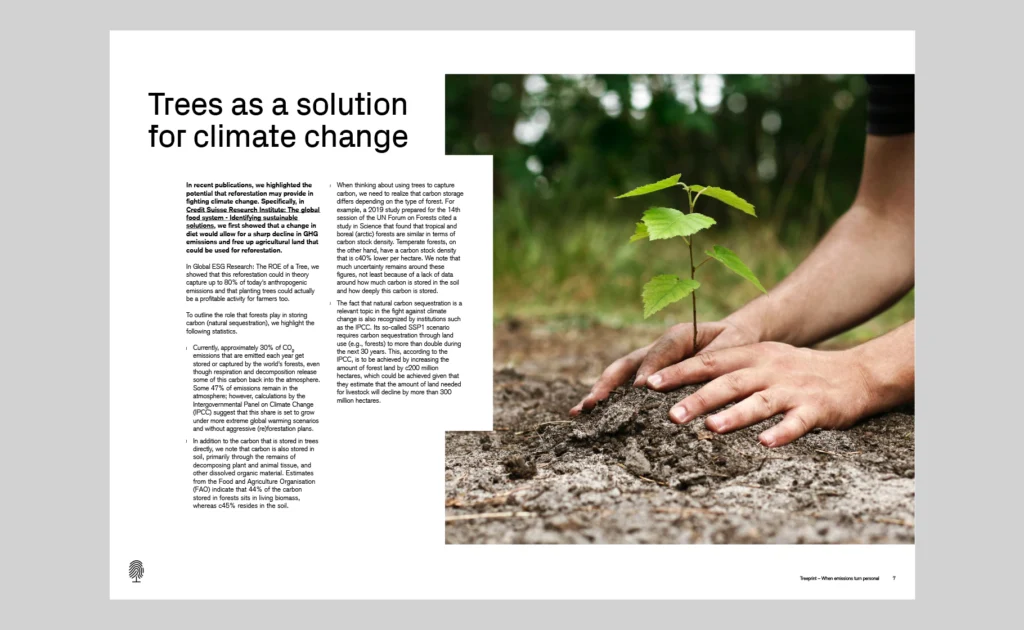
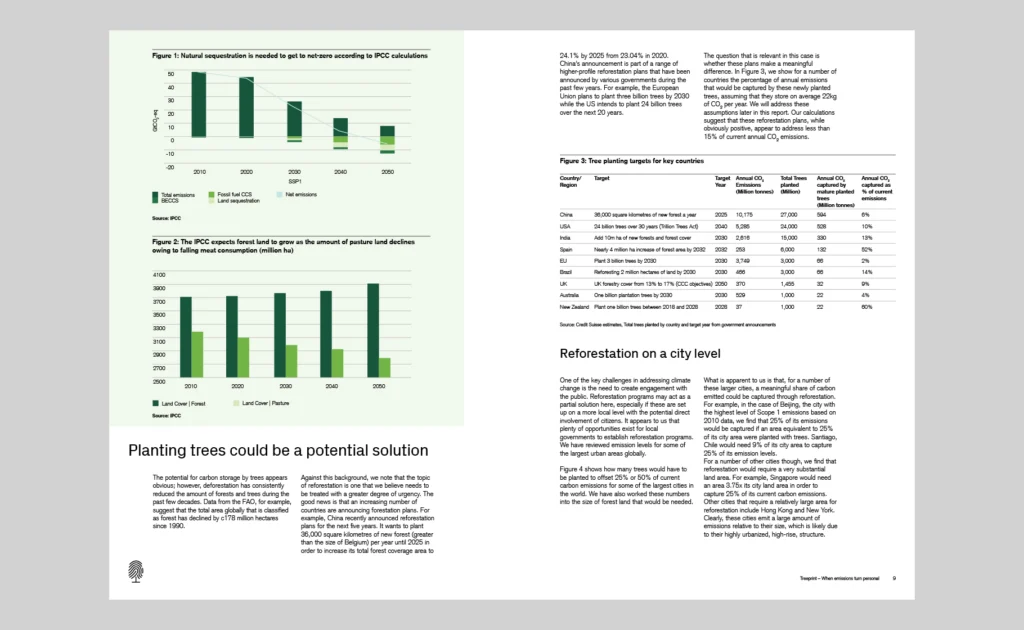
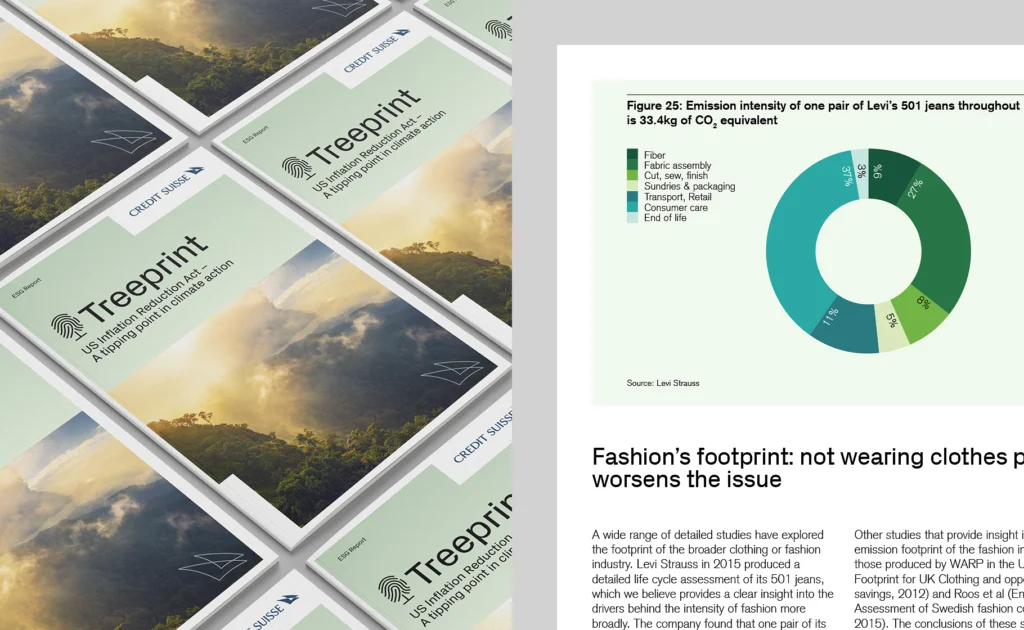
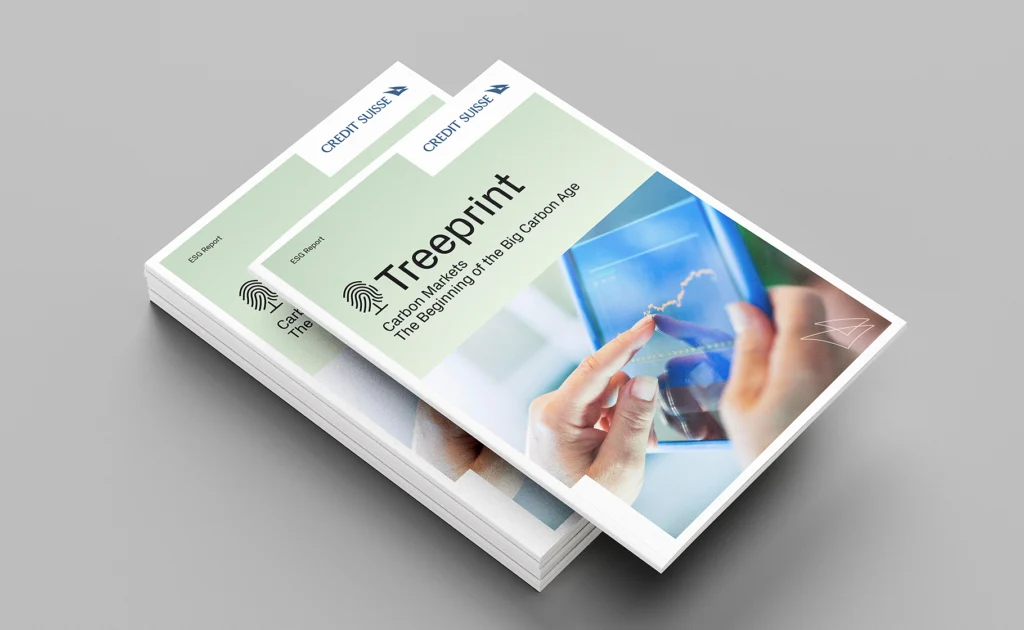
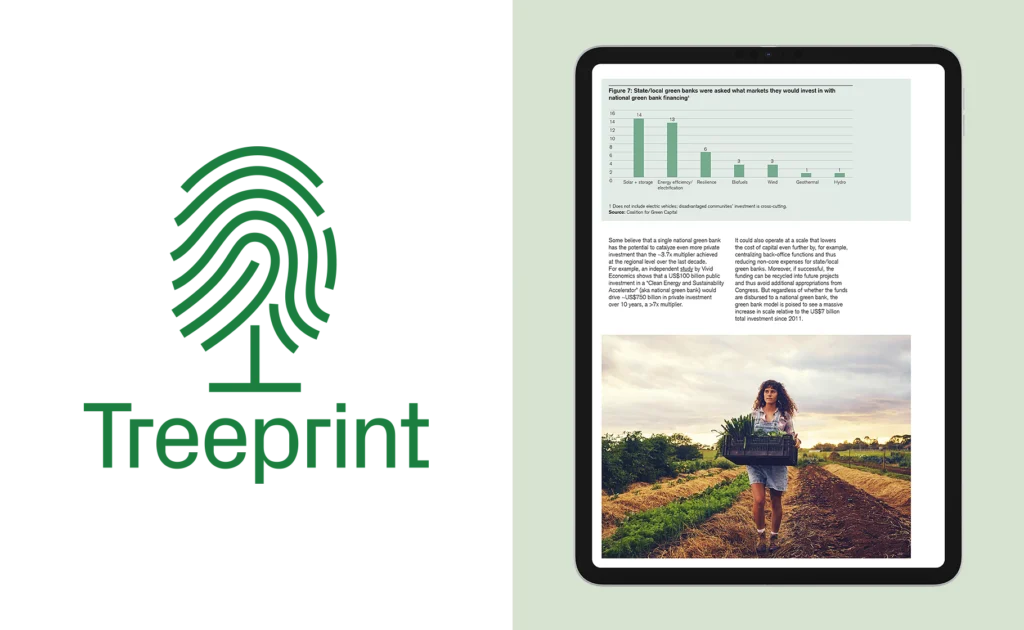
The result was a series of reports that combined precise data with a more accessible and engaging format. The editorial character helped move the publications away from the typical look of financial reports, while the system made it easier to develop subsequent editions.
Finance and ecology could therefore be presented not simply as a collection of numbers and charts, but as a story that is easier to understand and remember.